NXP Semiconductor N.V.
February 11, 2026 - by Joey Ramson
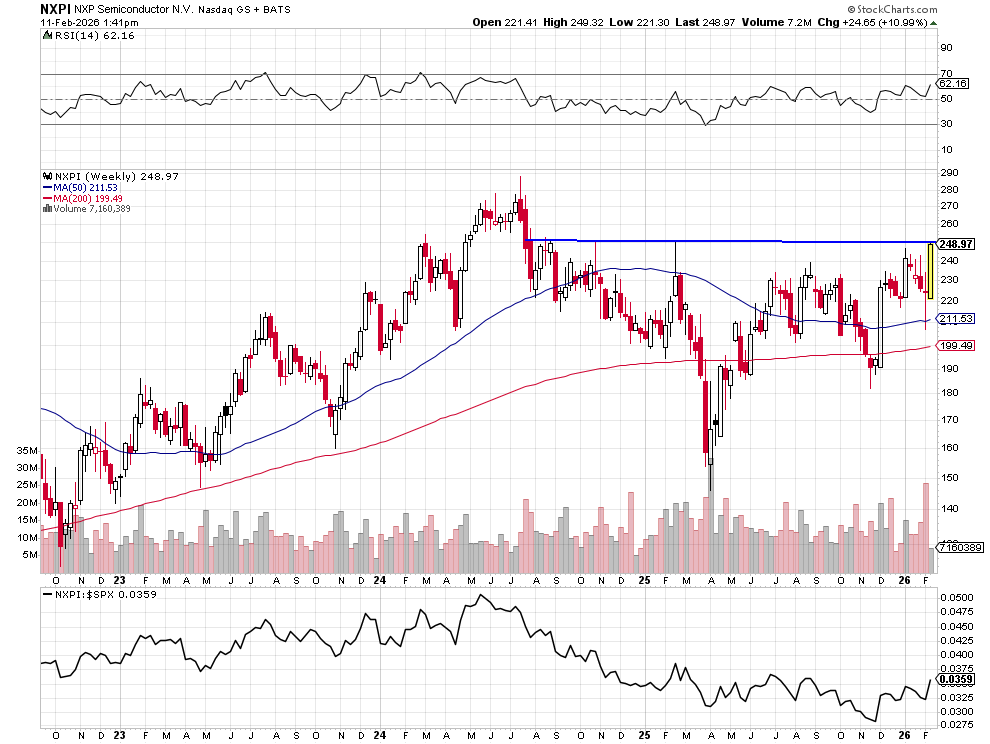
The $245–$250 zone has been one of the strongest long-term resistance levels on NXPI’s weekly chart. Every time price has approached this area over the last 2+ years, it has stalled or reversed — making this a key “line in the sand” for the next major trend.
-
It marked the peak in early 2024 before the stock rolled over into a year-long consolidation.
-
It rejected multiple breakout attempts in mid/late 2024, confirming it as a structural ceiling.
-
It aligns with an extended horizontal supply zone, where sellers have repeatedly stepped in.