$WIX Weekly Chart
October 27, 2022 - by Joey Ramson
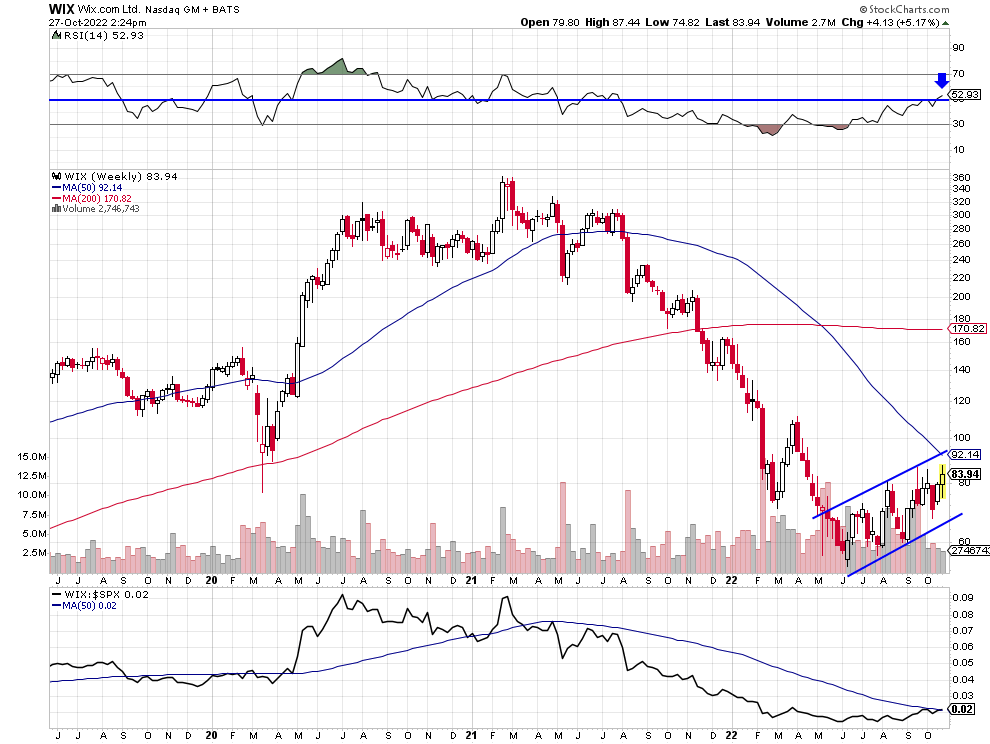
$WIX looks to be trading in a bearish flag on its weekly chart. With the upper flag trend line and the 50WMA converging to possibly offer strong resistance to an upward move. However there is a bullish divergence on the RSI. Crossing over 50 for the first time in over a year.